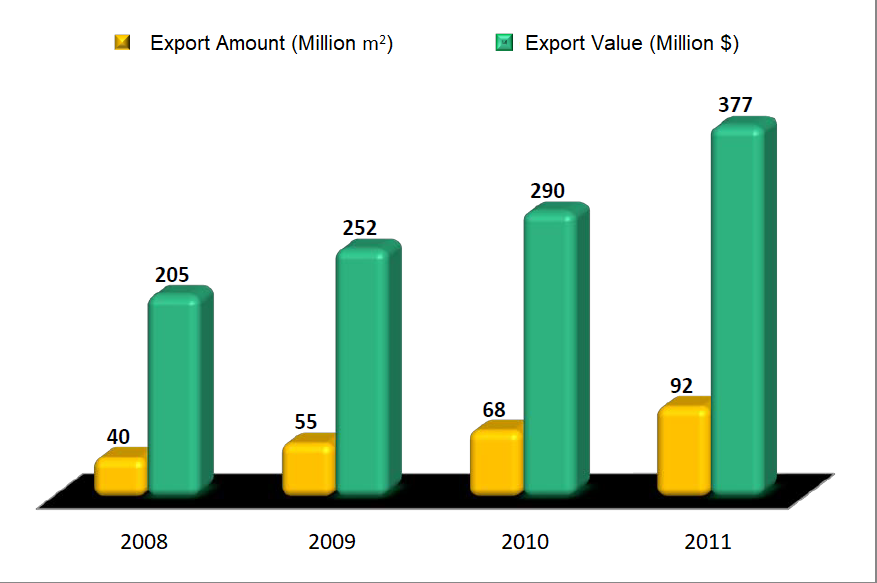
IRAN TILE AND CERAMIC EXPORT STATISTICS IN 2011
| Country | Export Value $ | % | Export Amount m2 | The Average Value for 1 m2 $ | |
| 1. | Iraq | 299760154 | 80.80 | 75734835 | 3.96 |
| 2. | Afghanistan | 37696762 | 10.16 | 9170018 | 4.11 |
| 3. | Turkmenistan | 13368517 | 3.60 | 3239574 | 4.13 |
| 4. | Azerbaijan | 6623246 | 1.79 | 1560079 | 4.25 |
| 5. | Tajikistan | 5825718 | 1.57 | 1377498 | 4.23 |
| 6. | Georgia | 4071892 | 1.09 | 1035954 | 3.93 |
| 7. | Uzbekistan | 3140239 | 0.85 | 814800 | 3.85 |
| 8. | UAE | 949352 | 0.26 | 233460 | 4.07 |
| 9. | Armenia | 873146 | 0.24 | 239312 | 3.65 |
| 10. | Russia | 687278 | 0.19 | 152420 | 4.51 |
| 11. | Kazakhstan | 594157 | 0.16 | 148537 | 4.00 |
| 12. | Qeshm Island | 310577 | 0.08 | 47016 | 6.61 |
| 13. | Kyrgyzstan | 255814 | 0.07 | 61666 | 4.15 |
| 14. | Oman | 219611 | 0.06 | 52702 | 4.17 |
| 15. | Syria | 151666 | 0.04 | 27412 | 5.53 |
| 16. | Turkey | 148721 | 0.04 | 27200 | 5.47 |
| 17. | Qish Island | 81284 | 0.02 | 16193 | 5.02 |
| 18. | Spain | 54353 | 0.01 | 5574 | 9.75 |
| 19. | Ghana | 43231 | 0.01 | 13198 | 3.28 |
| 20. | Qatar | 34489 | 0.01 | 9186 | 3.75 |
| 21. | Germany | 26171 | 0.01 | 8359 | 3.13 |
| 22. | Saudi Arabia | 25507 | 0.01 | 4188 | 6.09 |
| 23. | Bahrain | 24287 | 0.01 | 5779 | 4.20 |
| 24. | Korea | 16120 | 0.00 | 2847 | 5.61 |
| 25. | Italy | 14400 | 0.00 | 3379 | 6.05 |
| 26. | Malesia | 13856 | 0.00 | 2713 | 5.11 |
| 27. | Thailand | 11921 | 0.00 | 1398 | 8.52 |
| 28. | Sri Lanka | 10368 | 0.00 | 1547 | 6.70 |
| 29. | Cyprus | 9822 | 0.00 | 2727 | 3.60 |
| 30. | England | 5616 | 0.00 | 854 | 6.57 |
| 31. | Kuwait | 4800 | 0.00 | 98 | 49.17 |
| 32. | Canada | 4570 | 0.00 | 1086 | 4.21 |
| 33. | Swiss | 4008 | 0.00 | 1368 | 2.93 |
| 34. | Swaziland | 1492 | 0.00 | 397 | 3.76 |
fhfhft

jhku


